Astronomer: Saving Megabux with SQL and SimKube
Ok, folks, get ready, this is a fun one! I get to talk about some of the work that I’ve been doing over the last few months for Astronomer! If you’re unaware, Astronomer runs managed Airflow1 as a service: Airflow is a task-processing framework that lets you define dependencies between jobs in a DAG. For example, you can imagine some kind of data-processing pipeline, where the first job loads a bunch of data into a database, and then subsequent jobs do additional processing or transformation on the data. Also, as an aside, Astronomer announced support for Airflow 3.0 earlier this year, which makes them the only managed platform out there to support the latest Airflow features.
As you can imagine, providing Airflow-as-a-service requires some pretty heavy infrastructure investment2, and that was where I came in. Astronomer has a large Kubernetes footprint, across all three major public clouds, with a heavy mix of both internal and customer-managed workloads, and they approached me with the task of improving their infrastructure cost margins: something I have a bit of experience in! So let’s talk a little bit about what I did.
Step 1: Upgrading the tooling
For the first couple of months, I focused on learning my way around their codebase and platform so that I could better-understand where to focus my optimization efforts. I started by migrating Karpenter from the pre-1.0 version they were running to Karpenter v1. This was a little trickier than it sounds, because there were several breaking changes in Karpenter v1 to make it less AWS-centric and more in line with other (existing) SIG-autoscaling projects. The upgrade isn’t hard, per se, but it does require some careful sequencing and testing3.
Once Karpenter was upgraded, there were a few small-but-obvious improvements that I was able to make, both around the autoscaling side of things (we were able to make some small tweaks to the Karpenter node pools to use a better set of instances and use some new karpenter features), and the scheduling side of things, by adjusting the default scheduler to bin-pack pods more efficiently.
From there, it was time for the real challenge: figuring out what to optimize next.
Step 2: Building the margins dashboards
Like most companies running the Kubernetes platform, Astronomer uses Prometheus4 metrics emitted by Kubernetes for observability and monitoring. This is generally great, and I have a lot of experience with the Kubernetes metrics pipeline and PromQL in general, but the problem is, there are just so many metrics. SO MANY METRICS. And, in what is news to absolutely no one, observability is expensive. There’s a constant tension between storing the metrics that you need and not paying out the nose for it5. So most real-time monitoring and observability platforms play a lot of games with aggregation and adaptive resolution to try to keep the costs under control.
But the thing is, for cost optimization, you don’t need real-time monitoring, and you do need raw, unaggregated data. And just storing data is cheap, we know how to do that. So the first thing I did was start pulling data out of Prometheus and putting it into a relational database for long-term storage and analysis. From there, I was able to build out an entire set of dashboards which gave the company a brand-new window into their Kubernetes platform! Astronomer is now able to answer questions like “Which clusters have the best/worst CPU-to-Memory utilization ratio?” or “What Karpenter node pools are utilized most efficiently?” And, because this data is all stored in a long-term database, they can monitor the changes to their platform over time to see how things improve or if there are any cost regressions. Very cool!
As I mentioned before, however, just having the data isn’t enough, because there’s alot6 of it. You need to know what data to look at. Here I’ll give one specific example of how I was able to use the data to identify areas for improvement in Astronomer’s platform (note, all the graphs and charts presented here are made up and have no relation to the actual Astronomer platform; I’m just giving examples of the general approach I took):
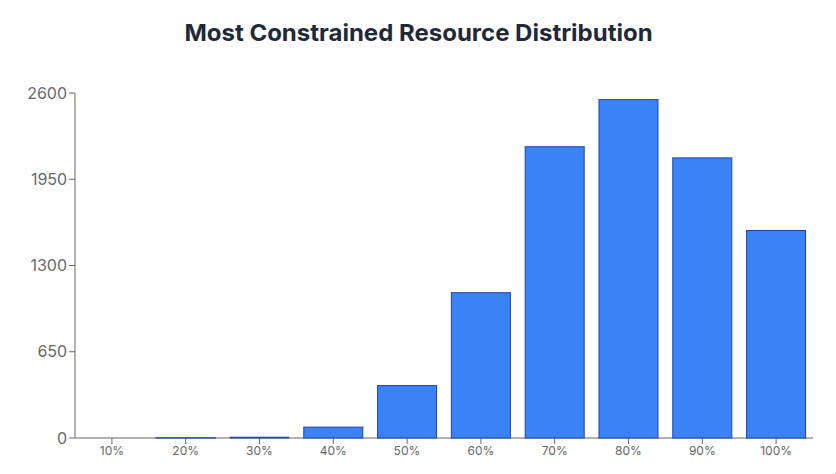
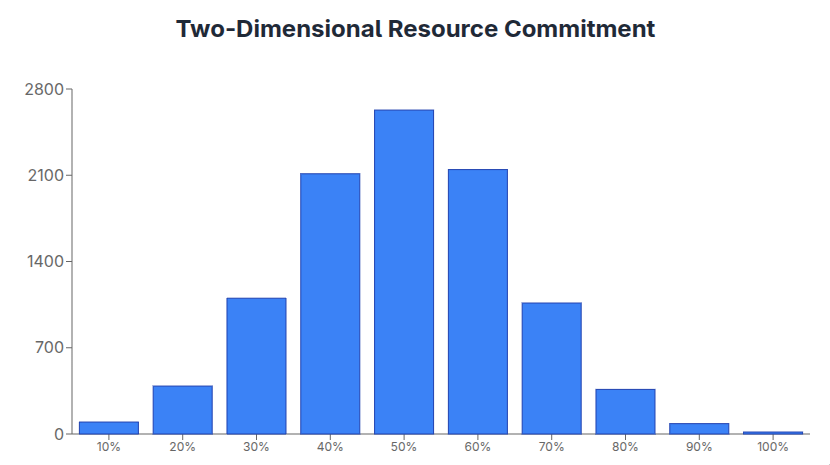
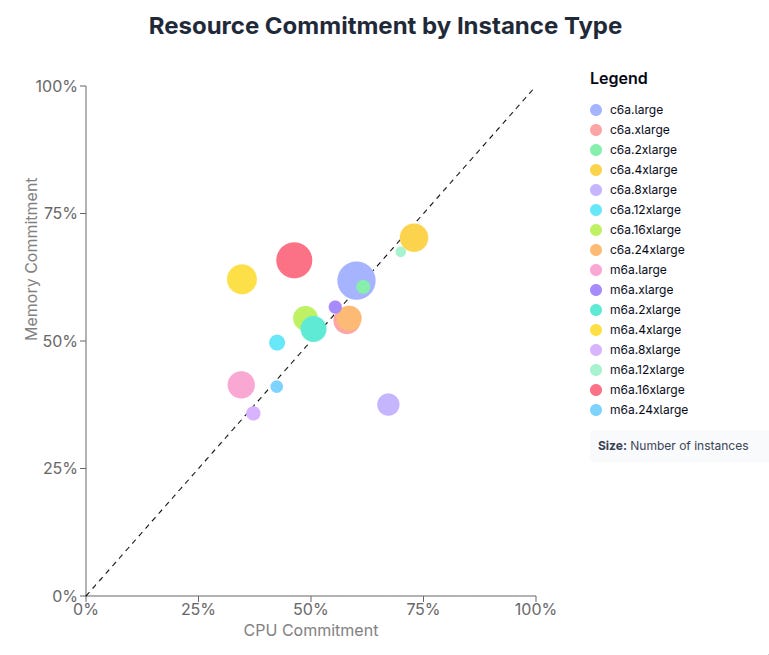
One of the dashboards I built for Astronomer analyzed their distribution of requested compute resources (e.g., CPUs and memory) in their clusters. Many places will look at their resource commitment (i.e., how many resources are requested by workloads) in isolation: that is, what fraction of their clusters’ CPUs are being used by pods, and, separately, what fraction of their clusters’ memory is being used by pods. This view is sortof helpful, in that you can see how efficiently you’re using these resources, but it doesn’t actually tell the whole picture. Many times you have workloads that are lopsided: that is, they request a lot of CPUs and a small amount of memory, or vice versa. What this can lead to are machines that are memory-constrained but have many idle CPUs, or the converse. To see if this was true at Astronomer, I built three graphs, looking at the “most constrained” resource, the overall (“two-dimensional”) commitment level, and lastly a scatter-plot of the CPU vs memory commitment by compute node type. Here are examples of the first two graphs, again with made-up data:


The first graph, the “most constrained” histogram, shows the distribution of nodes by their highest committed resource (either CPU or memory). The further bucket to the right a node is along that graph, the less likely it will be able to schedule new workloads, because it’s maxed out on one resource or the other. The second graph, the “two dimensional commitment” histogram, shows the total waste in the cluster: for each node, we compute the two dimensional commitment:
This is a bit harder to understand initially, but it shows the fraction of the total node resources being used by workloads scheduled on the node. Nodes that are in buckets farther to the right for the second graph are used more efficiently, because all of their resources are committed to workloads running on them.
Do you see the problem now? At Astronomer (and actually at many places I’ve seen) a lot of nodes were tightly constrained (because the distribution in graph 1 is weighted to the right) but there’s also a lot of waste in the cluster (because the distribution in graph 2 is weighted to the left). This is a problem! It means we can be doing things more efficiently. But how do we know what to change?
The third graph I created showed the answer (one last time, fake data ahead):

Here we see a scatter-plot of CPU and memory by compute node type. If nodes are being used efficiently, they will be close to the x = y line; this indicates that an approximately equal amount of CPUs and memory are being utilized on the node. If nodes are being used inefficiently, they will be far off the line. In the above graph, you can see that a few nodes are far off the x = y diagonal. If we can identify a common pattern for these instance types, maybe we can make some changes to make things more efficient!
And this is exactly what happened at Astronomer. Once we found the problematic instance types, I was able to make a couple changes to their Karpenter node pools that resulted in a (projected) low-six-figure-per-year improvement to their cloud bill.
Step 3: But wait, you said something about SimKube?
I’ll confess the title of this blog post is a bit misleading; identifying and fixing the above issue didn’t involve SimKube at all; the solution was pretty straightforward, and combined with the good testing tooling at Astronomer, I was able to verify the fix without SimKube. However, I did use SimKube as a second (independent) verification that the fix was correct, which allowed me to demonstrate that SimKube does work in Astronomer’s environment7. And this is exciting, because some of the optimizations I’m looking at in the future are not so straightforward, and will likely require some level of simulation to be able to test and verify.
More generally, I want to highlight that the approach outlined in this post is exactly how I think companies should be approaching this problem: first, you have to know where your problem areas are. In most cases, you need to have a secondary observability pipeline that’s focused on long-term metrics storage rather than real-time monitoring. Secondly, you need to build a hypothesis of what’s wrong: this is what I did at Astronomer by comparing the most constrained nodes to the overall two-dimensional node commitment. And third, before you make changes, you need to test your proposed fix to see if it actually works, and this is where SimKube comes in. By taking your real, existing production data, and replaying it inside a simulated environment, you can see the exact impact your changes will make on your cloud spend.
We’ve got a lot more work to do at Astronomer: it’s a fantastic group of people to work with, and I’m pretty excited about some of the opportunities that we have there, so watch this space for more in the future! And if you’re interested in learning more about applying this approach at your company, feel free to get in touch!
As always, thanks for reading.
~drmorr
Which, in a strange twist of fate, was developed by Airbnb, another company I have some experience with :)
Astronomer was also the first company I’ve worked for where the infrastructure was the product, instead of just having the infrastructure support the product. As an infrastructure person, it was really cool to be able to more directly tie my work to the company’s core offering, something that can be a challenge at direct-to-consumer-style companies.
One of my favorite things about this process was how easy testing was: unlike anywhere else I’ve worked, I could click a button and spin up a new Kubernetes cluster to test my changes on. It makes sense given that this is part of their core product offering, but it really is a development game-changer when you can create a complete, isolated environment in less than 15 minutes.
Prometheus is a time-series database that’s become the industry standard for monitoring; it’s pretty good at what it does, but it has some weird quirks. For example, the query language it uses is not SQL, which throws a lot of people off. It uses mathematical operators (+, -, *, /) for joins, and it only knows how to store time-series data, which leads to a lot of Kubernetes metrics that have a time-based component for no reason.
This is not an Astronomer-specific problem, btw. Every company I’ve worked for or talked to has struggled with the high cost of observability.
I also found and identified several bugs and necessary improvements to SimKube in the process, which is exciting to me.


