



At ACRL, we get to talk to a lot of clusters… I mean people. Many of those people manage clusters at scale1, which we don’t recommend, but we all have our burdens. In conversations with these individuals, who will remain nameless to protect the guilty, we often hear something like, “at made-up-for-this-fake-example Corp., we’re only utilizing 67% of our capacity”.
And to that I want to say: “What do you even mean, bro?”
I’m a bit of a student of economics, by which I mean I lost a lot of money in crypto scams and now I have to do this to survive. But I once had an economics professor who would respond whenever you mentioned a rate like productivity, efficiency, or utilization with a simple question: “Of what?” This was a polite way of saying: “Tell me the damn numerator and denominator, and do it right now.”2
Specificity matters, and at scale, it matters a hell of a lot. Today, let’s give ourselves permission to be a bit pedantic, because we can’t afford not to.
A cluster (under)utilized
In the lead-in to this series, drmorr teased the five key metrics for evaluating autoscalers. We’re starting off with committed capacity percentage: a cost-oriented metric that reveals how much of our provisioned capacity we’ve committed to workloads.
“Capacity Utilization” sounds like a straightforward efficiency metric. Unfortunately, as an industry, we are pretty abstract about what utilization is and how we measure it. If you Google cluster utilization, you will get a terrible AI overview, followed by an ad, followed by a fistful of different definitions, including some of the following:
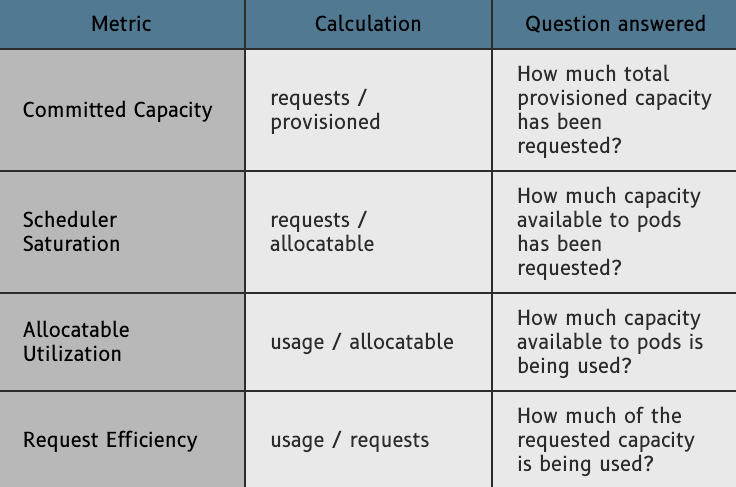
These are all perfectly valid calculations, but they all measure different things. When someone says, “Our utilization is 57.62%,” I still have to ask “Of what?”
For our five metrics for evaluating autoscalers, our interest in utilization is as an inverse proxy for waste. For a comparable workload, a higher utilization metric should indicate we are provisioning less excess capacity. It does not prove that those uncommitted resources are removable or that all the requests are necessary. We’ll get to that in a moment.
Show me the money
I’m going to spoil this right out of the gate. If we had to choose just one metric for the cost component of our five metrics for evaluating autoscalers, it would be Committed Capacity Percentage. Well… sort of.
Where:
R = Total scheduled pod requests
C = Total provisioned node capacity
Typically, committed capacity is calculated separately for CPU and memory. Here, “requests” means the resource requests of non-terminated pods on the nodes we are measuring. Unscheduled pods represent unmet demand rather than commitments against the current nodes and should be tracked separately.
Why this ratio? We love money, dude3.
We’re paying somebody good money to provision nodes. Any capacity above what is required to support our workload is a cost worth investigating. The numerator tells us how much capacity workloads have claimed. Our denominator shows the full provisioned node capacity.
Waste REVEAL thyself
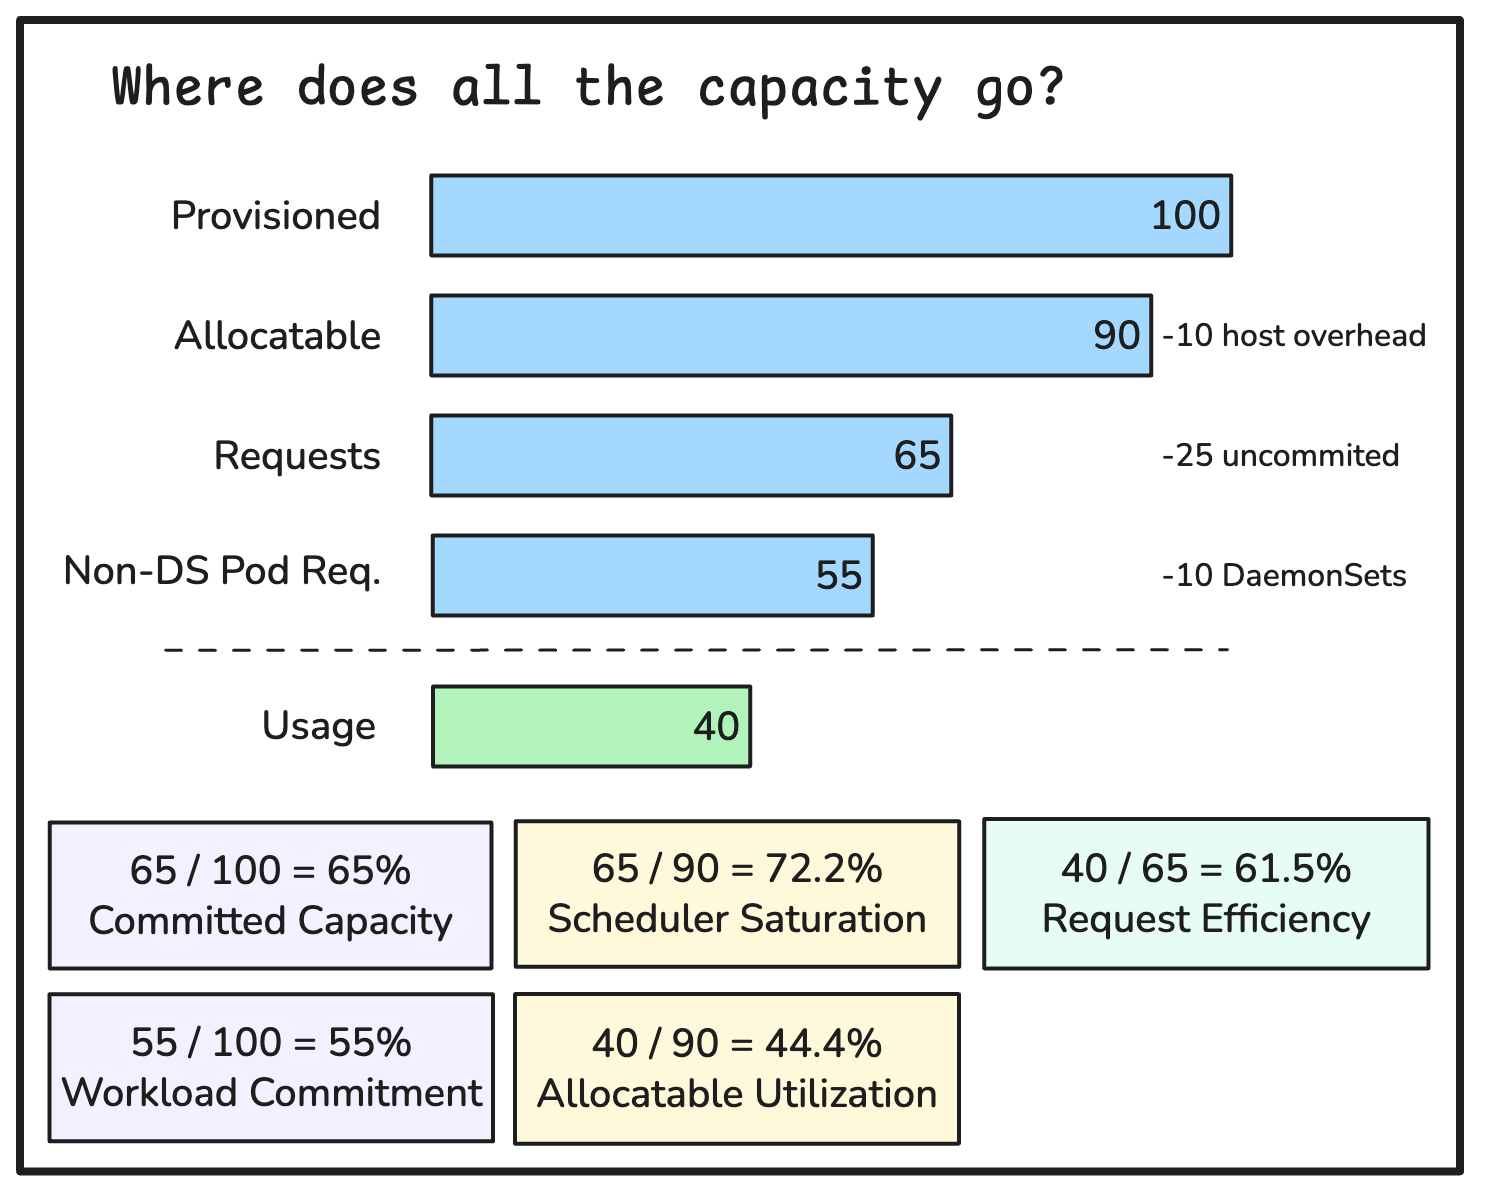
Before we start hunting down waste, we need to understand where that capacity went. Total provisioned capacity is not all available to pods. First, we have to reduce our provisioned capacity by host reservations and eviction headroom, giving us our allocatable capacity. Pod requests can claim up to all the remaining allocatable capacity.
It’s important to note that kubeReserved and systemReserved belong to a different class of reservation and are not included in pod requests (our numerator). Requests from DaemonSets, however, are pod requests and are included in the numerator. If we were to use allocatable capacity as the divisor, we would lose visibility of the overhead inherent in kubeReserved and systemReserved. Some of this overhead is 100% necessary.
In most cases, the capacity of a node has two primary dimensions: CPU and memory4. How the scheduler fits workloads onto nodes is called bin packing and, since we have two dimensions, we actually have a 2D bin packing problem5. Bin packing is a fascinating, complex domain; however, it is quite easy to visualize potential excess capacity with a conceptual diagram. To illustrate the complexity of this problem see the following diagram: efficiently bin packing a bunch of squares of equal size is quite easy, but inefficiencies emerge quickly with real workloads: we’ve got long, short, big, small, squares, and rectangles creating many inefficiencies in the packing of this node6.
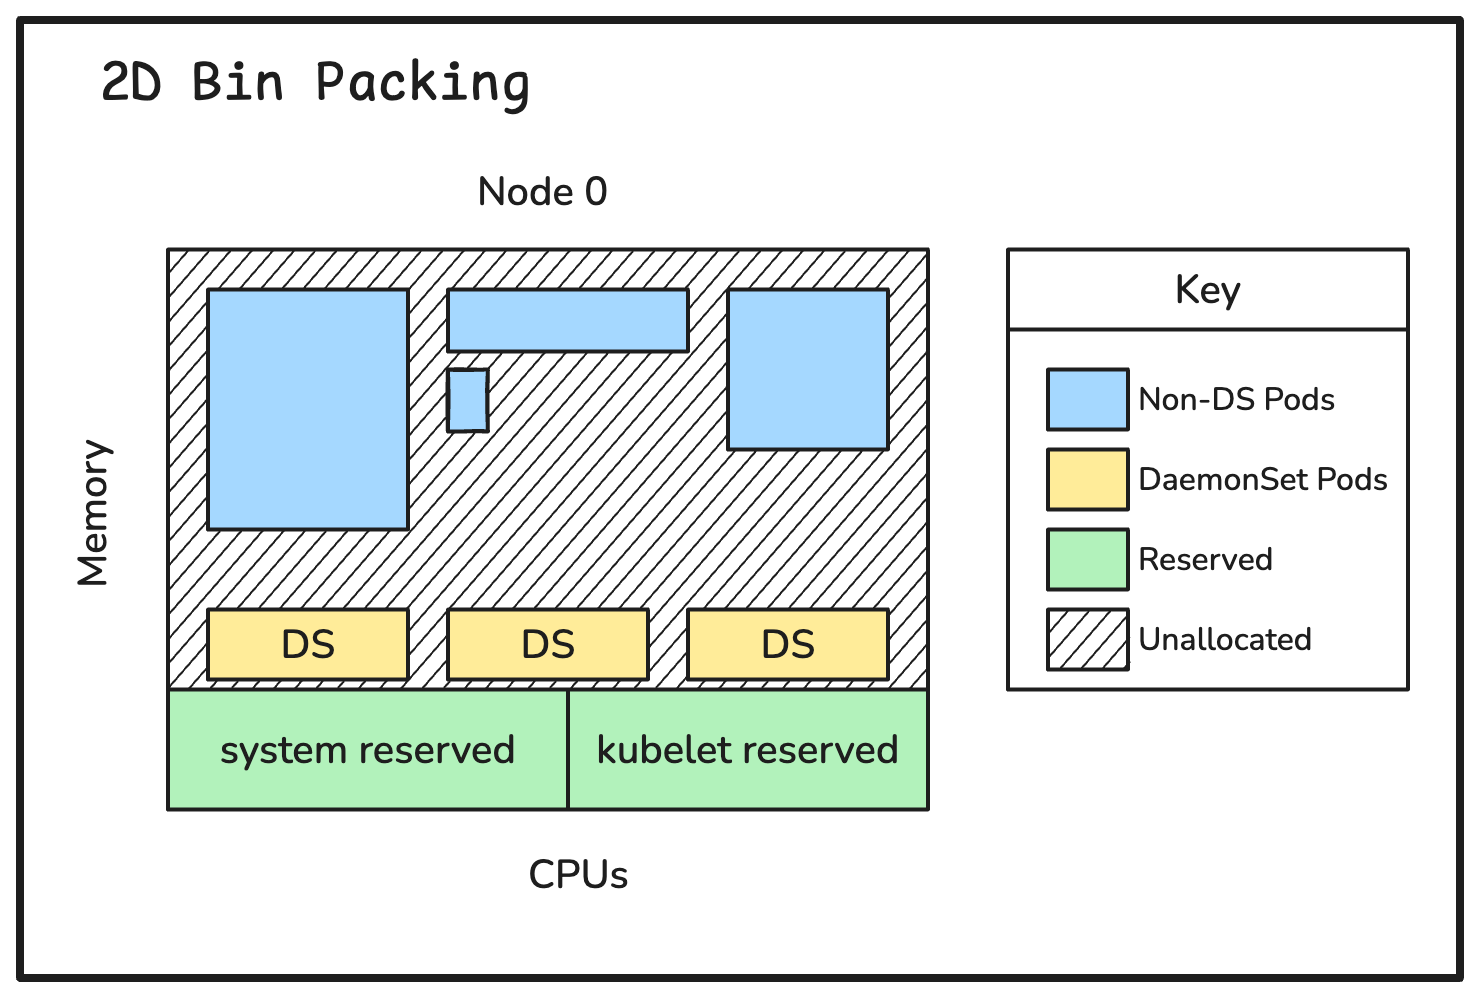
Bin packing is just one place inefficiencies appear. Other sources of excess capacity may include slow or inefficient scale-down, node/pod shape misalignment, and stranded resources due to scheduling constraints. When these cause additional resources to be provisioned for the same requests, committed capacity falls. Committed capacity percentage can show us that one or more of these symptoms are present, but it will not identify the cause.
We also can’t tell from this metric alone if the excess capacity is waste. Some headroom is necessary for a well-functioning cluster; it aids in faster scheduling and overall resilience. That’s why the goal is not 100% committed capacity percentage. An organization might have a lower provisioned capacity because of a valid reliability concern, which is also why this is just one of our five metrics. That all sounds great, right?
Wait a second. Some of our allocatable capacity is claimed by DaemonSet replicas on each of our nodes. What if we increased our node count while keeping total provisioned CPU and memory unchanged? In this scenario, our DaemonSet replica count would rise and committed capacity percentage would increase. That seems like the opposite of what we want in a metric for evaluating autoscalers. We would prefer a measure that decreases as overhead increases7. Additionally, our output metric (the numerator) should be closely aligned with the actual application workloads; after all, the platform is designed to serve customers, not the other way around8!
With that said, we are pleased to announce, Workload Commitment Percentage, a modified committed capacity metric which addresses this loophole and is more closely aligned with the actual business objective of your clusters.
Where:
R = Total scheduled pod requests
D = DaemonSet pod requests
C = Total provisioned node capacity
By keeping the denominator as our total provisioned capacity, we still have the broad cost basis for our metric. We exclude DaemonSets from the numerator so as DaemonSet overhead rises our Workload Commitment will fall.
PromQL Example
Disclaimer: This probably won’t work at scale or maybe at all. But hey, knock yourself out.
avg(sum(kube_pod_status_phase{phase="Running"}
  * on (pod) max by (pod) (kube_pod_container_resource_requests{resource="cpu"})
  * on (pod) max by (pod) (kube_pod_owner{owner_kind!="DaemonSet"})
  * on (pod) group_right max by (pod, node) (kube_pod_info)
) by (node) / on (node)
sum(kube_node_status_capacity{resource="cpu"}) by (node))
Point of order: Ian, are you stupid?
If you talk to your platform teams, nobody actually tracks this metric, and why not? Is it because we’re stupid? No, it’s because it’s hard to do. Here’s a quick comparison of the other metrics that are easier to track, and why we recommend doing the hard thing anyways.
Why not requests / allocatable?
What we are calling Scheduler Saturation helps us understand how much of the schedulable budget is claimed. For our cost-oriented comparison, we want the full provisioned resource budget in the denominator. Necessary host reservations still occupy capacity on the nodes we are paying for.
Why not usage / requests?
Request efficiency helps us determine how closely requests match observed consumption. It can expose oversized requests, which are worth investigating. But it can’t see an empty node. Add an idle node without changing the pods, their requests, or their usage, and this ratio stays exactly the same, but our bill won’t. Additionally, requests are not limits, so usage over 100% of requests is possible and a value below 100% isn’t necessarily waste.
Why not usage / allocatable?
Allocatable Utilization tells us how busy the capacity available to pods is. This is a helpful metric for investigating resource pressure.
For evaluating node autoscaling, this leaves something to be desired. The denominator is only our allocatable capacity, which is not what we actually pay for. A useful metric for answering a different question.
Why not usage / provisioned?
Measuring usage against the full provisioned budget can help evaluate our overall infrastructure efficiency. We choose requests because we’re interested in how efficiently the autoscaler accommodates the resource demands of the cluster. Whether that demand is appropriately sized is another question that is absolutely worth asking.
Let me break this for you
Great, we have a metric. Let’s game it.
If we simply traversed our cluster and increased the requests on our application pods, we could improve our Workload Commitment without doing anything useful like, I dunno, reducing total cloud costs.
Larger requests also reduce the placement options for pods and make node consolidation harder for node autoscalers. If the changes produce more nodes, costs could increase.
There are other ways this percentage can mislead us:
A cluster-wide average can hide resources stranded on specific nodes. You can’t take CPU from one node and supply it to a pod on another node.
An autoscaler could leave unsatisfied demand and earn a good score by keeping its existing nodes full. So we would see a high workload commitment percentage but many pods awaiting capacity9.
A higher percentage on expensive nodes could cost more than a lower percentage on cheaper nodes. CPU and memory percentages are not denominated in dollars.
For autoscalers to reduce spend, they must make or induce changes at the node level: fewer nodes, cheaper instance types, or both. Other pricing changes can reduce spending too, but workload commitment doesn’t measure them.
Use this metric to compare provisioning under comparable workload and reliability requirements. Don’t treat it as proof of savings or a ranking system for otherwise unrelated clusters.
Why track it anyway?
Maybe you are thinking, “Well, Workload Commitment is imperfect, maybe we shouldn’t worry about tracking it at all.” However, this is a useful signal that is cheap(-ish) to calculate. You can get all the request data easily from Kubernetes’ native metric sources. Workload Commitment is a great frontline metric and provides a good indicator of avoidable cluster costs10.
Conclusion
Workload Commitment Percentage is our first look at the cost side of evaluating autoscalers. It tells us how much provisioned capacity has been claimed through requests for non-DaemonSet workloads. It can’t tell us if the requested amounts are sensible, if excess capacity is justified, or whether our applications received the capacity they needed quickly enough. That’s why we have four more metrics on the way.
Thanks for reading the ACRL blog. Be sure to subscribe to catch the rest of the series!
Cheers,
Ian
Sometimes the clusters also manage people at scale
An early draft of this article included a graph with unlabeled axes. This professor is now rolling over in his grave. RIP to a legend.
Seriously, please subscribe. We’re running out of mochas over here.
We’re ignoring resources such as GPUs, storage space, network bandwidth, etc. since these are more specialized and if you’re using them in your autoscaling we assume you already know what you’re doing.
Before you flip your lid, Reddit. This is a CONCEPTUAL diagram for a SIMPLIFIED example.
Not all DaemonSets are platform overhead.
You have those… right? Can you share some with us?
TIL
Assuming your observability team isn’t dropping metrics all willy-nilly to keep costs down.