



🚨🚨🚨 drmorr is speaking at OSACON today Monday, November 2nd, @ 2:15PM PT. You can tune in to hist talk 10 Useful Dashboards You Can't Make with Grafana watch on YouTube here. 🚨🚨🚨
Welcome to the final installment of our series: five key metrics for evaluating autoscalers. Maybe this series was your introduction to the ACRL blog, or perhaps you’ve been here since the first footnote. We’ve enjoyed writing this1 series and we hope to run into many of you at KubeCon 2026 SLC. Until then, buckle up because we’ve got one more metric to go, and this one is going to be a real rollercoaster; that’s right, we’re talking about application churn.
Application what?
You’ve got yourself a helpful pod autoscaler, but what, it can’t make up its damn mind? Your replica count for your super-awesome-application keeps oscillating from two to three to two to three in an endless loop. That’s the churn we are talking about today. A good autoscaler, well configured, should minimize the churning of replicas and preferably without a ton of fiddling2.
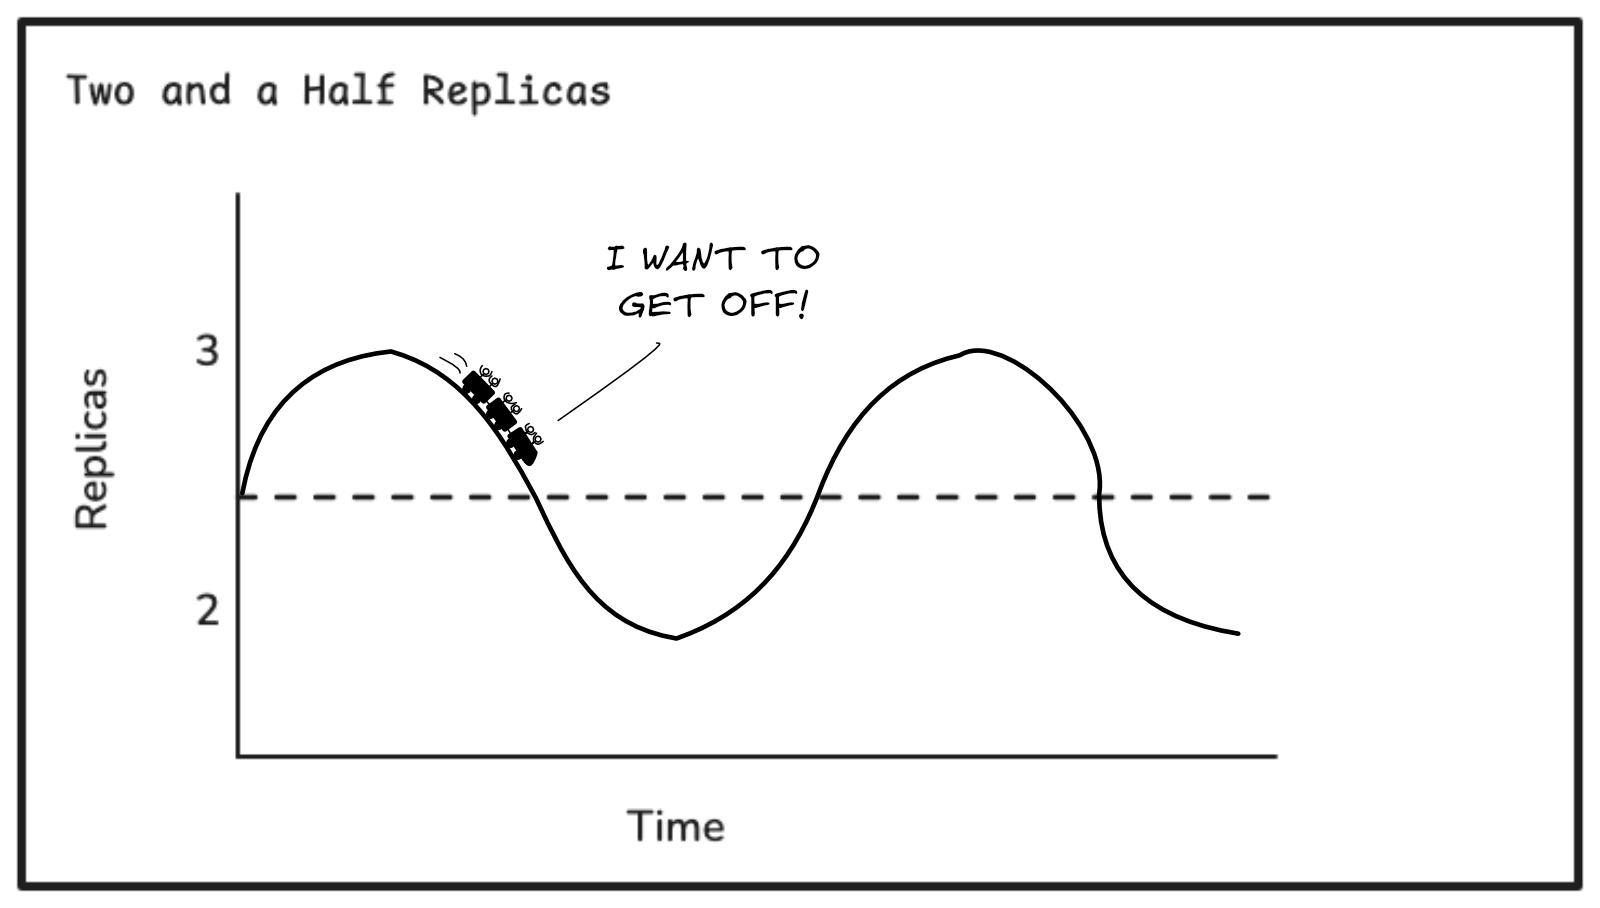
Look dude, I just operate the platform
Well, here’s the thing: even if you have no real responsibility for the applications you run ON your perfectly architected, exquisitely executed, and lovingly maintained platform, you’re going to want to keep an eye on this. Application churn is a platform problem, and it’s got knock-on effects bigger than just replica count that can impact how your entire platform scales. Let’s investigate!
Root causes
The oscillation in the replica counts (like we’ve shown for) super-awesome-application can be caused by a variety of issues; allow me to over-simplify:
Replicas are integers
Kubernetes has no way to express half, or one-third of a replica. It can only express whole integer replica counts, but our metrics contain a range of measures between integers, so we are forced to do some rounding. If the rounding is at the boundary of our autoscaler’s rounding rules, we could easily flip back and forth between two and three replicas, for example.
Controller Aggressiveness
Imagine an autoscaler set to scale on every change in a metric3. You are likely going to see replica counts changing rapidly. Now, consider the opposite: maybe you’ve set the autoscaler with a very long observation period so it takes a long time before scaling up, down, or both. We have to make sure we set our controller aggressiveness justttt right4. We want to be responsive, but we don’t want to freak out.
Control loop delays
Your autoscaler is, hopefully, using some metrics to calculate the desired replica count and collecting metrics introduces delays. So unless we are forecasting we are optimizing for what the application needed in the past, which may or may not be what your application needs right now.
Noise
All metrics include some noise. We may even dismiss them as “outliers”. Other metrics are erratic or “spiky”. Depending on how your autoscaler is configured, you might be scaling up then right back down, and that could be a very good thing or a complete and total waste5.
User Error
Also, maybe you are just holding it wrong? Honestly, we can’t rule it out. Autoscalers can be finicky and often take time to dial in to just the right settings to produce the behavior your application needs, despite many promising the moon in three easy clicks.
Why should you care?
Churn is not just generating pod disruptions. Every time we launch a pod, we incur a penalty: the time it takes to start our pod. Depending on your workload, this can be anywhere from milliseconds to minutes. That’s capacity we are paying for in our nodes that is being taken up by workloads that aren’t doing anything yet. If that capacity is being taken up because of unnecessary churn, then it is waste. When replica counts are oscillating, all that noise in your cluster can add up quickly. Every new pod incurs the startup cost.
In addition to that warmup time, we are introducing a lot of instability in the platform. Pods come and go, and the scheduler is built to accommodate these workloads more or less efficiently. By adding churn, we are making the scheduler’s job even harder by introducing unnecessary constraints that change rapidly. Excess replicas can result in node scale-out, which adds avoidable costs to your platform.
For these reasons, we argue you should absolutely care about application churn. A well-functioning autoscaler will minimize application churn without preventing the necessary scaling behavior your platform needs to serve your customers. Assuming I’ve convinced you, let’s track it.
Making up metrics
Designing a metric that captures churn is straightforward. We can begin by capturing the absolute value of all our replica count changes as they occur as a counter. For this to be a useful metric, we want to window it so we can aggregate it within the window and compare over time. For example, we could arbitrarily set our window to 60 minutes. When our replica count changes within the window from, say, two replicas to four, we add two to our counter. When it decreases from four to three, we add one. Our total application churn for the window would be three.
Where rt is the desired replica count at time t.
Let’s see this in action with a few examples:
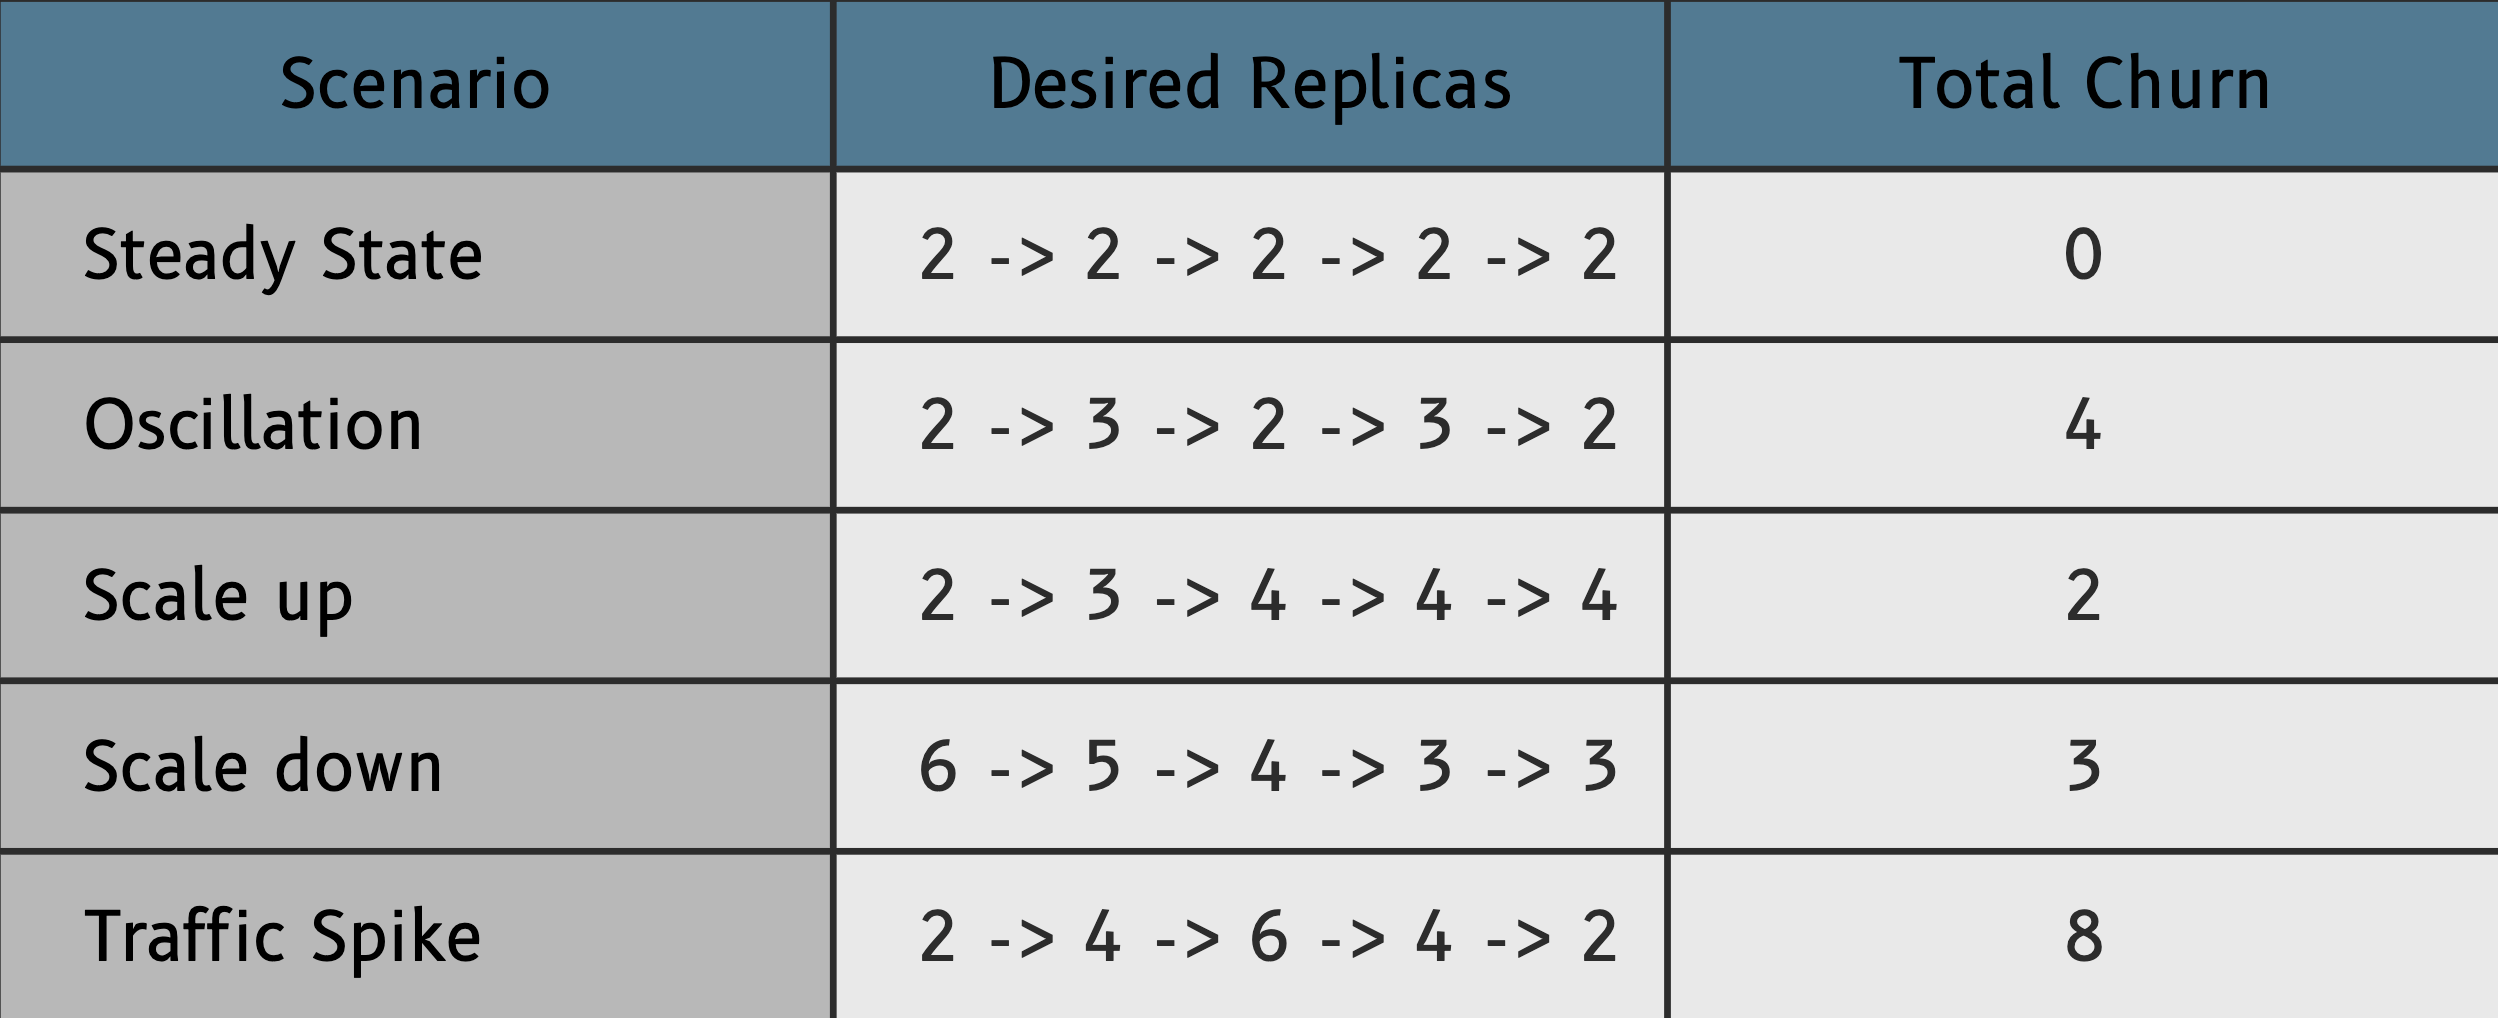
As you can see, this metric captures all our replica count changes as churn. Directionally, this does a lot of what we want. As oscillation behavior increases, so does our churn metric. If we map out a longer cycle of these short examples, the scale-up and scale-down examples exhibit much less churn than the oscillating example, but our traffic spike example is hard to determine. But can we do better? I think we can.
Since our metric is windowed, this gives us an interesting opportunity: our time range is bounded in 60-minute windows, so we have a beginning and ending value for our replica counts and can further refine our churn rate example by reducing our total churn by the net change over the period. Effectively, this adjusts our churn for the “net change” which is controlled by our windowing period. This small adjustment gives us credit for scaling that “sticks”. Now, This still does not solve the traffic spike example, but it effectively controls for some of “necessary” scaling in our scale up and scale down examples.
Where:
rt is the desired replica count at time t
r0 is the initial replica count
rn is the final replica count.
For the same examples above:
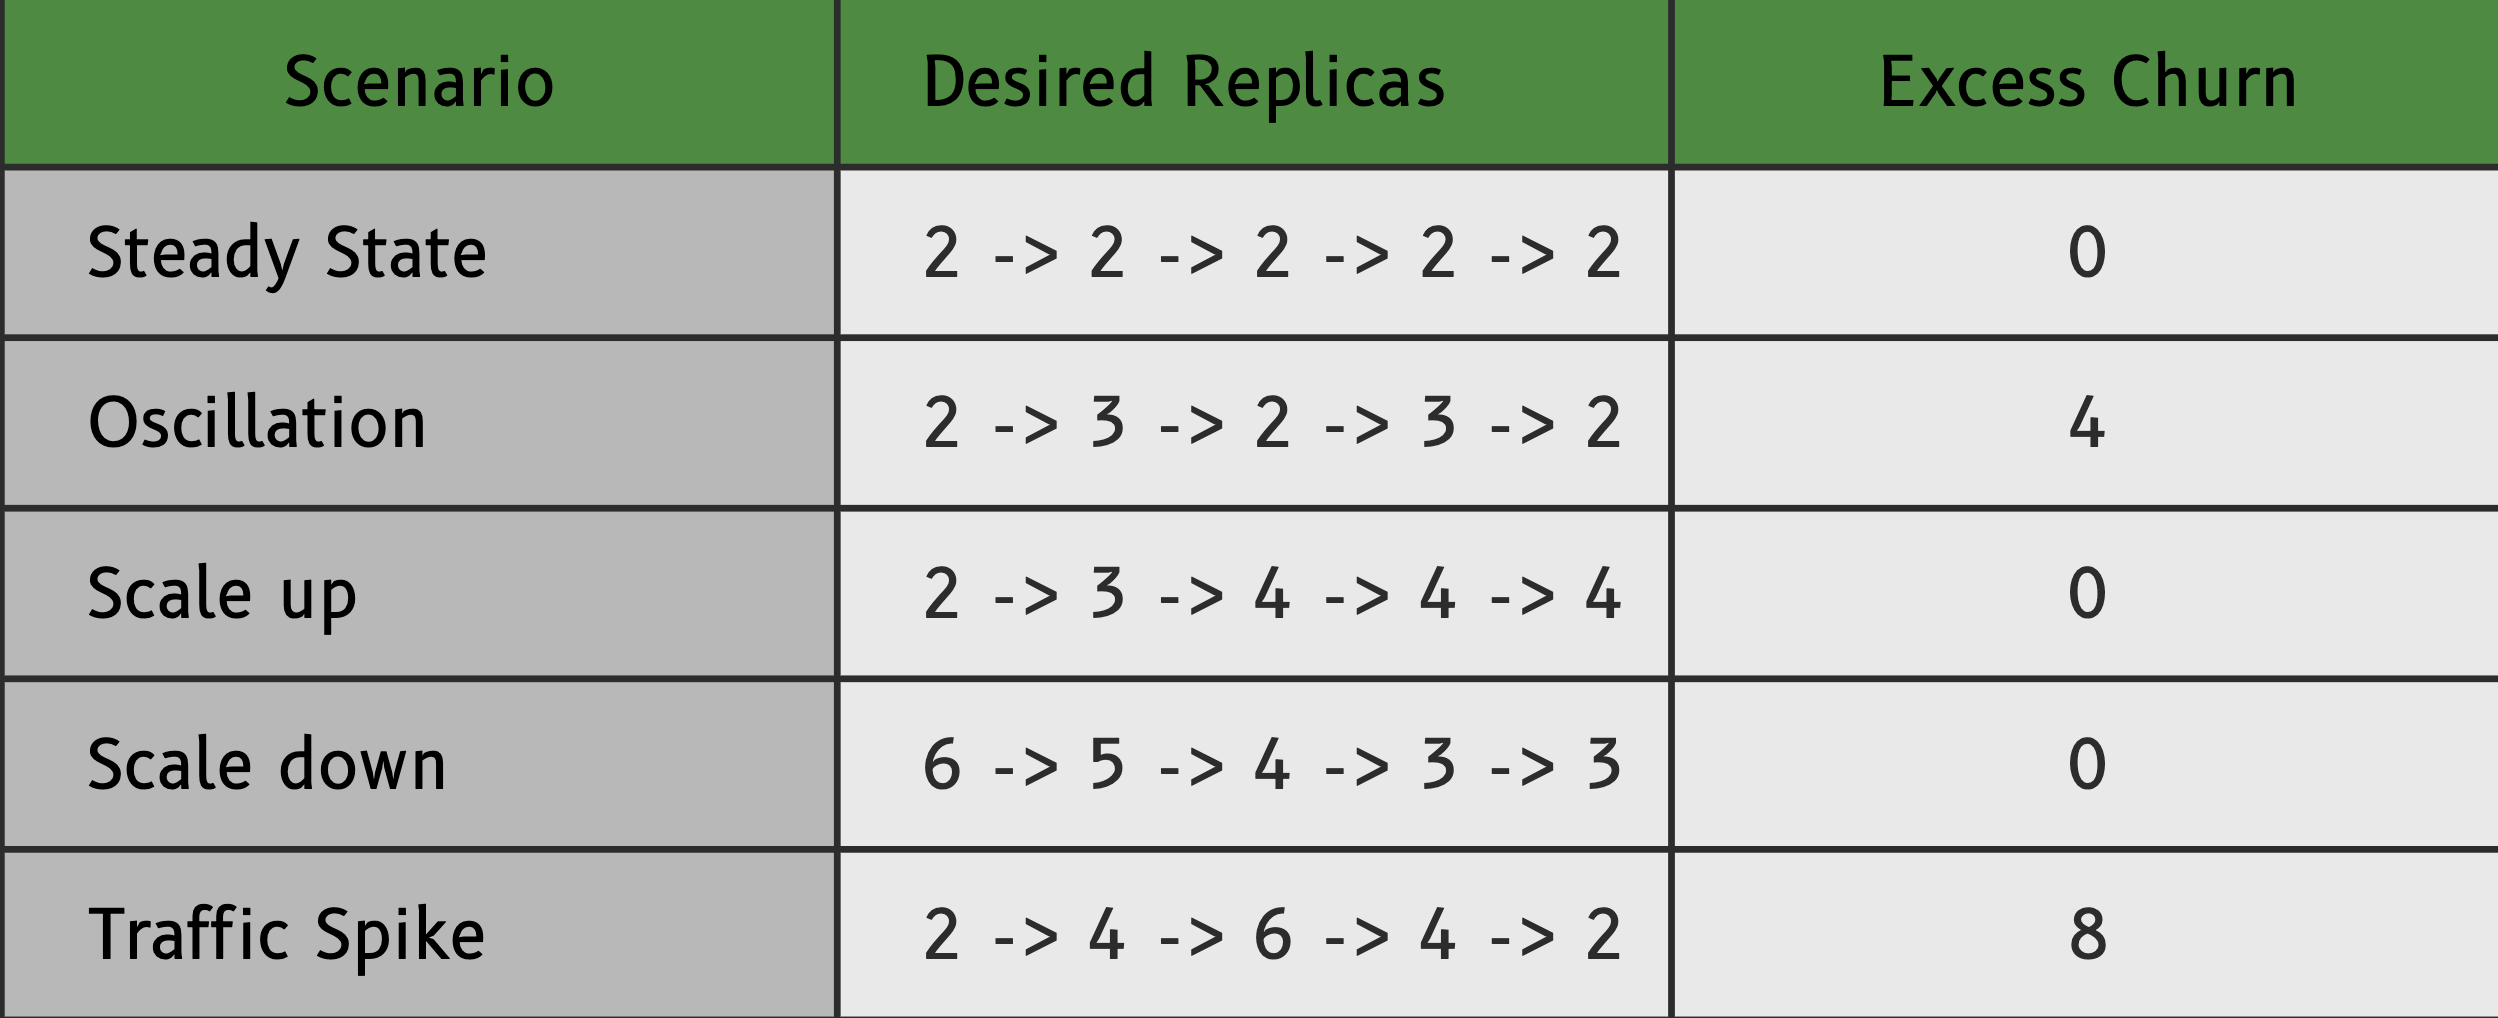
Unfortunately, this can’t tell us that this Excess Churn is truly excess or that our net change was necessary, but for those who are interested in studying churn closely, this refinement can provide a clearer signal of the excessive churn inside your clusters.
Many mitigations
If you are tracking your excess churn, and you want to do something about it, here are some knobs and buttons worth pondering:
Use Tolerances
Where possible, ignore small deviations from the target. HPA, for example, uses a tolerance mechanism with the cluster-wide default being 10% with scale-up and scale-down tolerances that are independently configurable.
Use Stabilization Windows
Wait for consistent evidence before reversing a scale-up decision. This is critical for disrupting the oscillation feedback loop that is responsible for a large amount of excess churn. By requiring a stabilization period before reversing course on a scale-up, we can prevent an unnecessary scale-down that leads eventually to another scale-up.
Consider Rate Limiting
Limit how many replicas can be added or removed in a given time period. Rate limits are aggression control for scalers. Rate limits slow the speed of correction and can be particularly useful in limiting the scale-down behavior of your workload. Slower correction speeds help prevent over-corrections.
Noise Reduction
Use averages or other filtering techniques to smooth scaling signals. Outliers happen; demand can be highly variable, so nobody panic. We want to respond to trends without freaking out and scaling overly-aggressively based on very short-term inputs.
Use High Quality Signals
Use metrics that closely represent the actual demand. A higher quality signal is better than smoothing a poor one. If your metrics do not closely align with the demands of your application, get a better metric. Don’t scale on teraflops6 per parsec if queue depth is a better signal for your application.
That’s five, it’s over
There you have it, we promised the five key metrics for evaluating autoscalers, and we delivered. To recap the five metrics are:
If you check the scoreboard closely, you will see we snuck in a few extras and alternatives. We hope this series has inspired you to approach your observability team to sheepishly ask them to add one or all of these metrics to one of your many dashboards.
I kid, what we actually hope is that this series has expanded your mind and made you think deeply about the many metrics we use to monitor our platforms and autoscalers. If you absolutely loved7 this series, we’d love to talk to you about it at KubeCon SLC 2026. The ACRL team will be there wandering the vendor floor with stickers and a mostly positive attitude.
Cheers,
Ian
P.S. Stay tuned for KubeCon coverage and wrap-up post!
Slightly unhinged.
lol, right.
That’s… aggressive.
YMMV.
In this scenario we are Goldilocks.
Is a teraflop even relevant in 2026? What are we chasing now zetaflops?
Or if you absolutely hated it